Devices
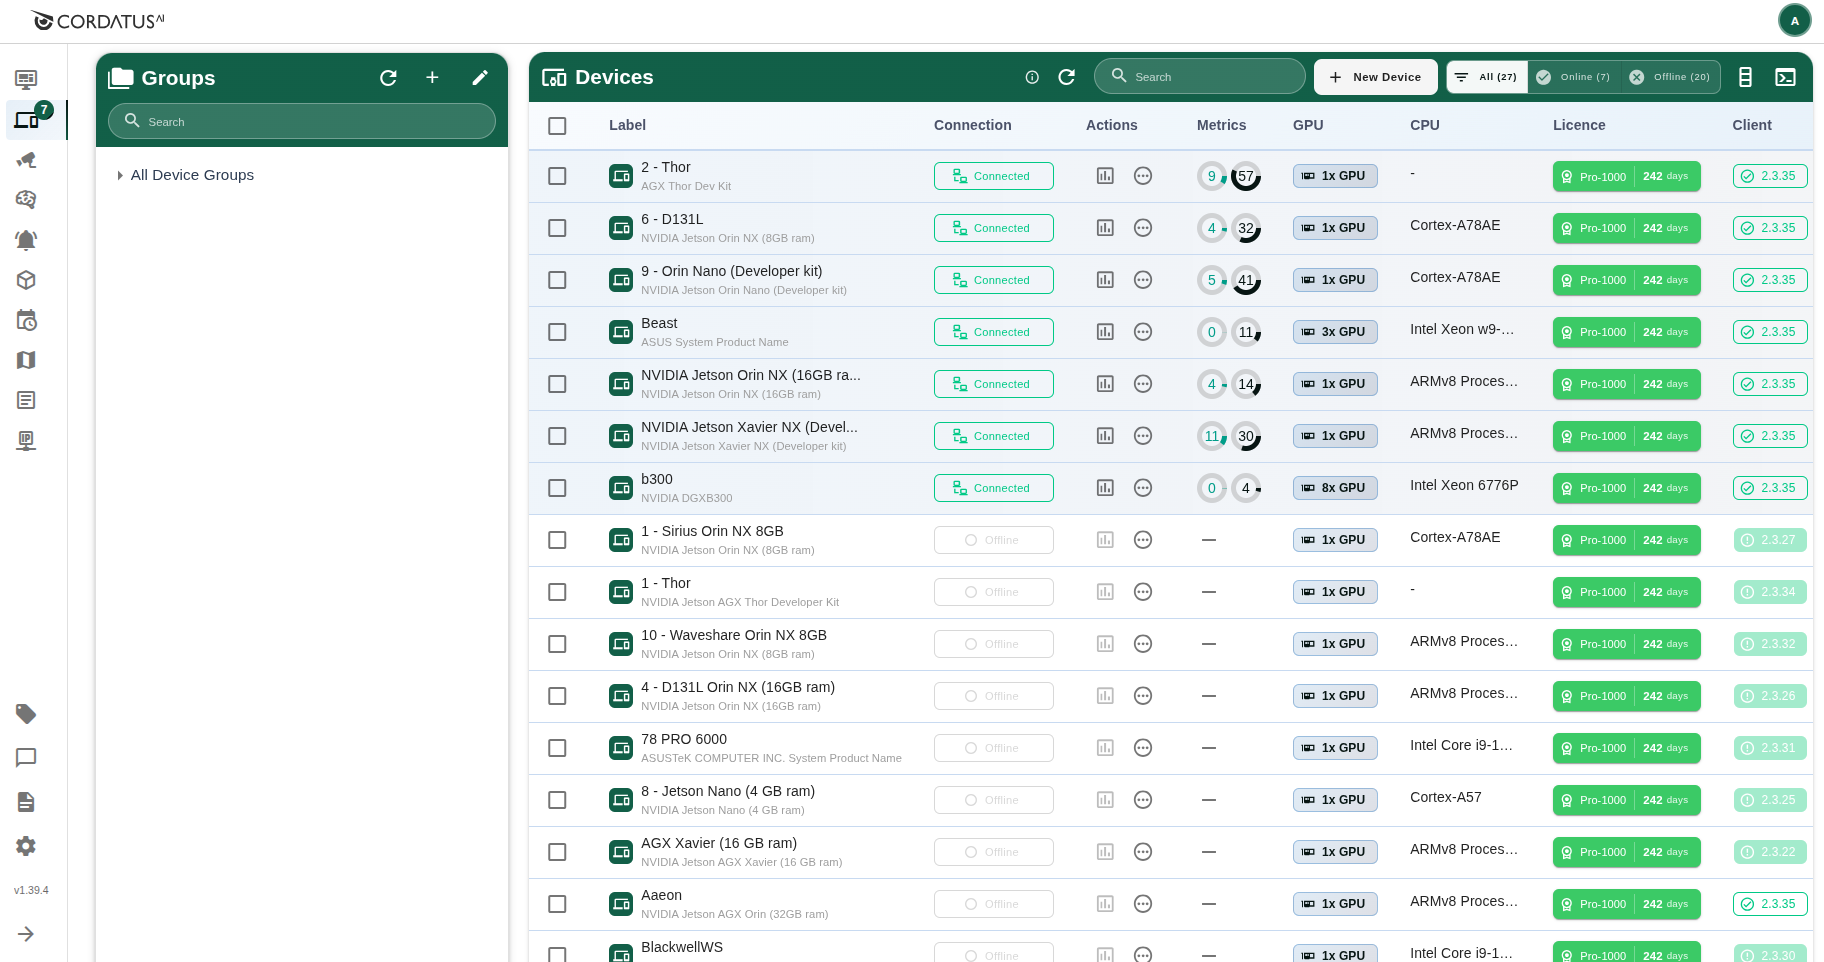
The Devices page is the starting point for managing your devices. It displays your entire fleet in a single table. When you install the Cordatus Client on a device, it automatically appears here. You can quickly see key details, search and filter, sort columns, select multiple devices, and start common actions.
At the top of the Devices section, the number badge next to the title (for example, 13) shows the count of devices that are currently Online or Connected.
This gives you a quick overview of how many devices are active at the moment.
Device list
The Device List displays all devices in a table format.
Each row represents one device, and each column shows a key property such as status, hardware details, or client version.
You can sort the table by clicking on a column header. Pagination controls are at the bottom right (Rows per page, Next/Prev). Refresh icon at the top left updates the table with the latest status and metrics.
- License — Current license type
- Label — Device name and description (click the edit icon to rename)
- Connection — Device status (Offline, Online, Connected)
- Metrics — CPU and RAM Utilization
- CPU — Processor model
- GPU — Number of GPUs
- RAM — Total system memory
- Client — Installed Cordatus Client version
- Uptime — Time since last system restart
- Actions — Icons for management and monitoring actions
Search a device
Use the search box at the top right to quickly locate devices. The search matches the keyword in Label (device name) and Description.
- Type a word or part of a word (e.g.,
edge-01,orin). - Results update as you type.
- Click the × (clear) icon to reset the search.
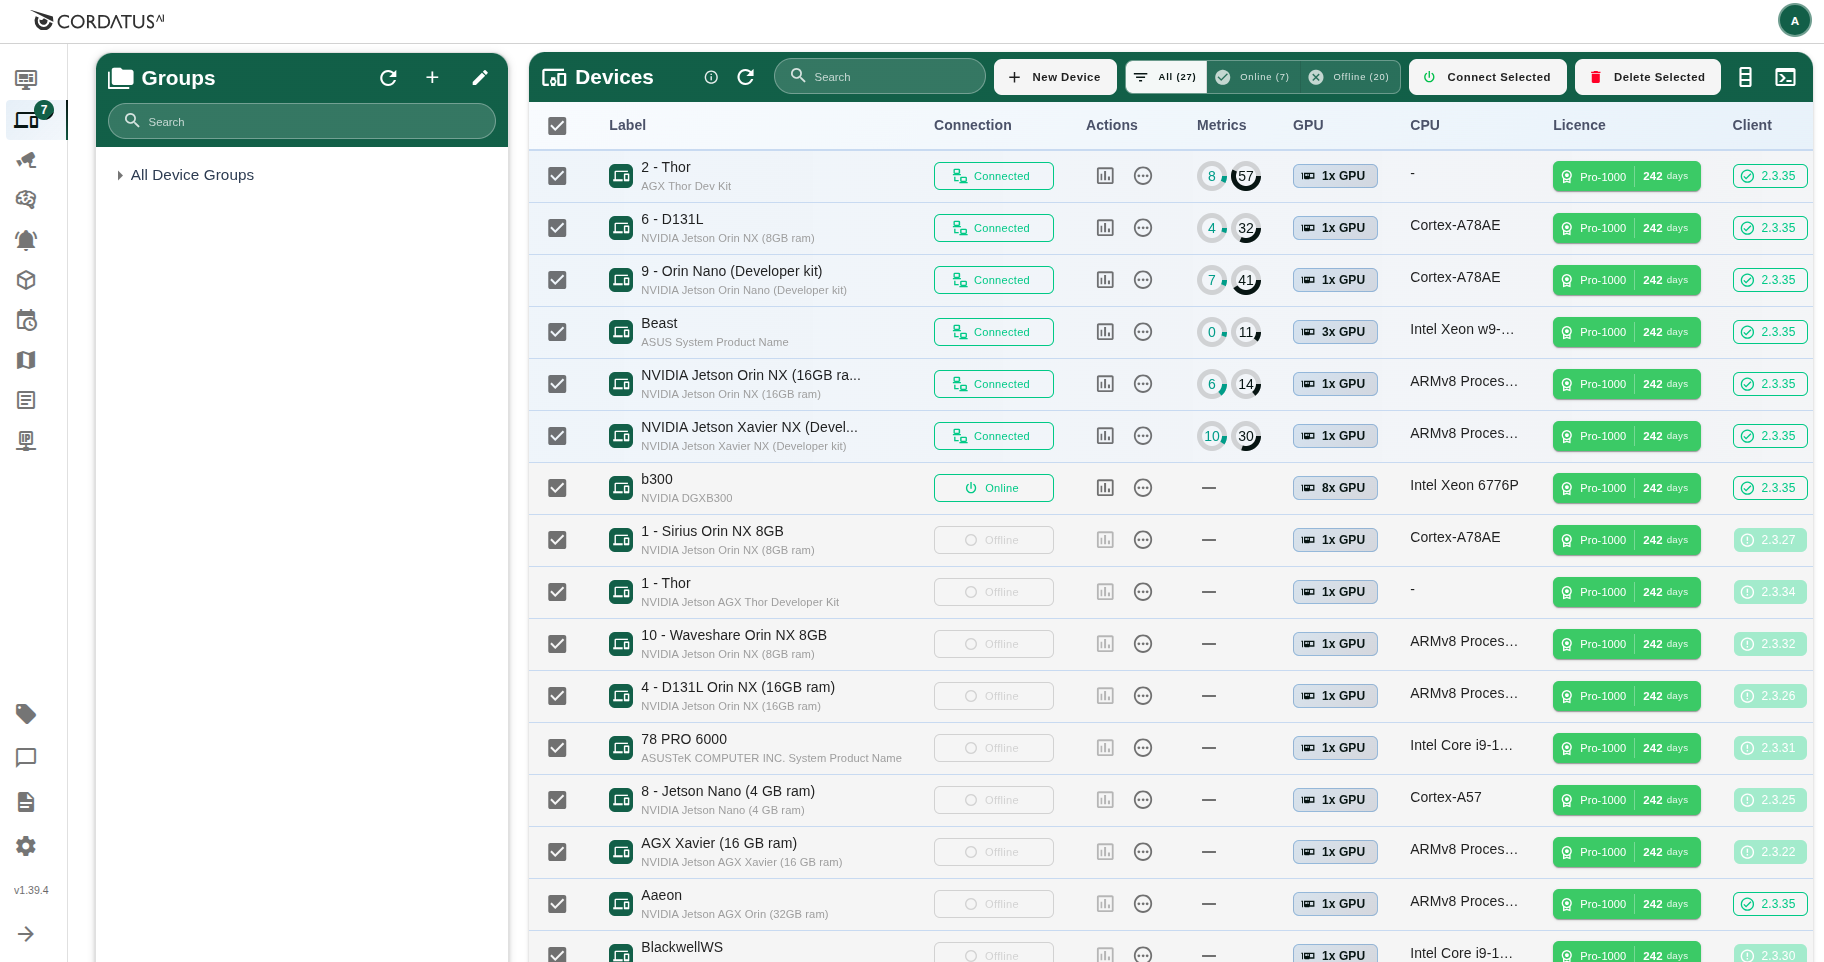
Selection and bulk actions
- Use the checkboxes in each row to select one or more devices.
- Use the header checkbox at the top of the table to select or clear all rows on the current page.
- After selecting, a Bulk actions bar appears on top.
Available bulk actions:
- Connect — Connect all selected devices at once.
- Remove — Remove multiple devices from your account.
Actions
Each device row has two icons in the Actions column: Metrics and Ellipsis. These provide different sets of features.
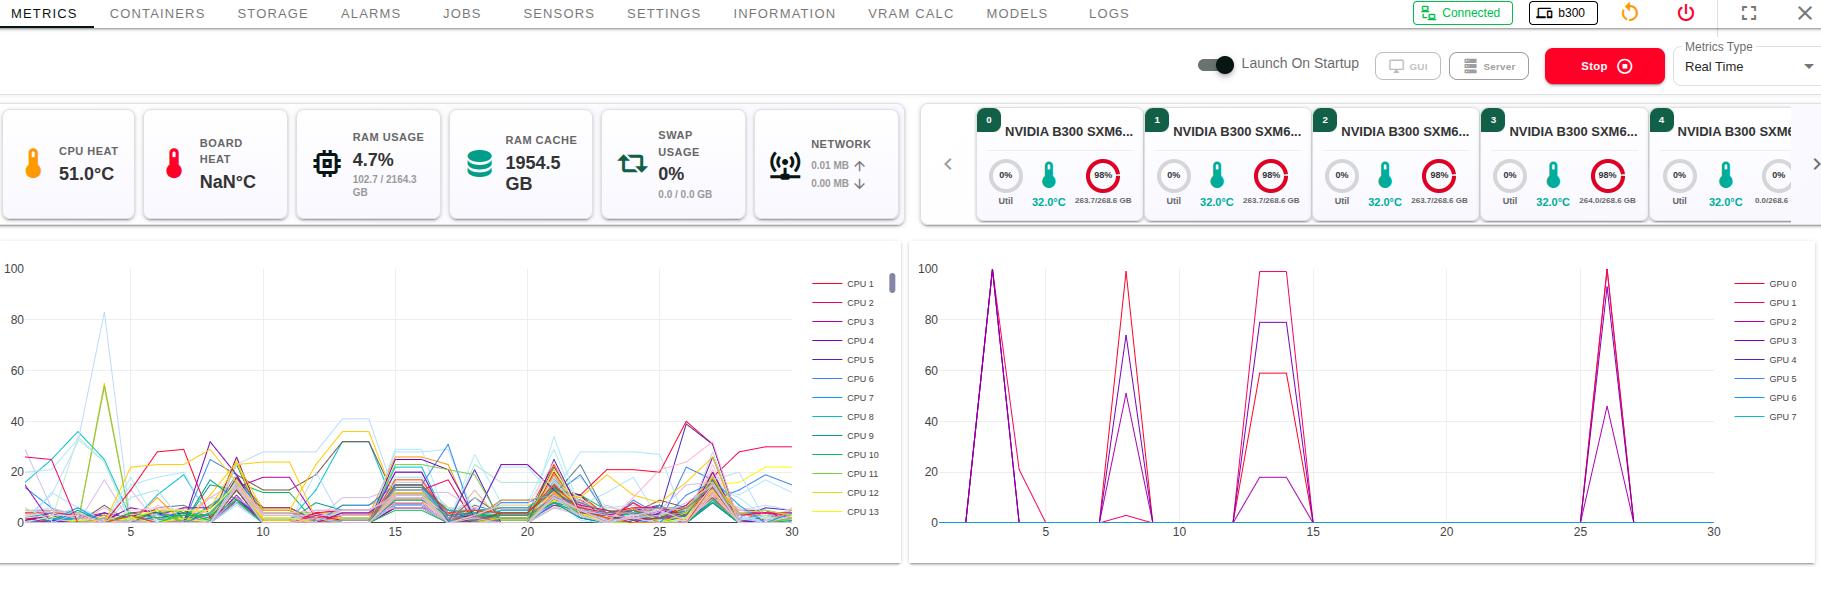
Metrics Panel
-
Metrics — View realtime charts and query historical data.
See details → MonitoringThe top-right control bar also includes:
- Launch on Startup — Automatically start the Cordatus Client when the OS boots.
- Restart — Reboots the operating system of the device.
- Shutdown — Powers off the device safely.
- Metrics Type — Switch between Realtime and Historical views.
- Stop - Toggles device metrics (same as turning Check Device Metrics OFF). Use Start to resume.
-
Containers — See running containers on the device and manage them.
See details → Containers -
Storage Info — Disk/partition usage and capacity.
See details → Storage -
Device Alarms — Toggle alarms defined for the device.
See details → Alarms & Events -
Jobs — Device-level jobs and their status (if license includes this feature).
See details → Jobs -
Sensors — List and manage connected sensors.
See details → Sensors -
Settings — Configure client and system preferences. Includes:
- System Check — Verify the status of system components and containers (Metadata, Inference Engine, RabbitMQ, Cossa, Docker, Signal, Tunnel).
- Client & Engines — Inspect active engines and runtime processes on the device.
- General Settings — Startup behavior, SSH restart, sudo clearing, and connection notifications.
- Alerts & Metrics — Connection/Disconnection Alert, Check Device Metrics, and Save Device Metrics.
See details → Settings
-
Jetson Control Center (Jetson only) — Power modes, fan control, Jetson Clocks.
See details → Jetson Control Center -
x86-Info (x86 only) — System information and license features.
See details → x86 Info
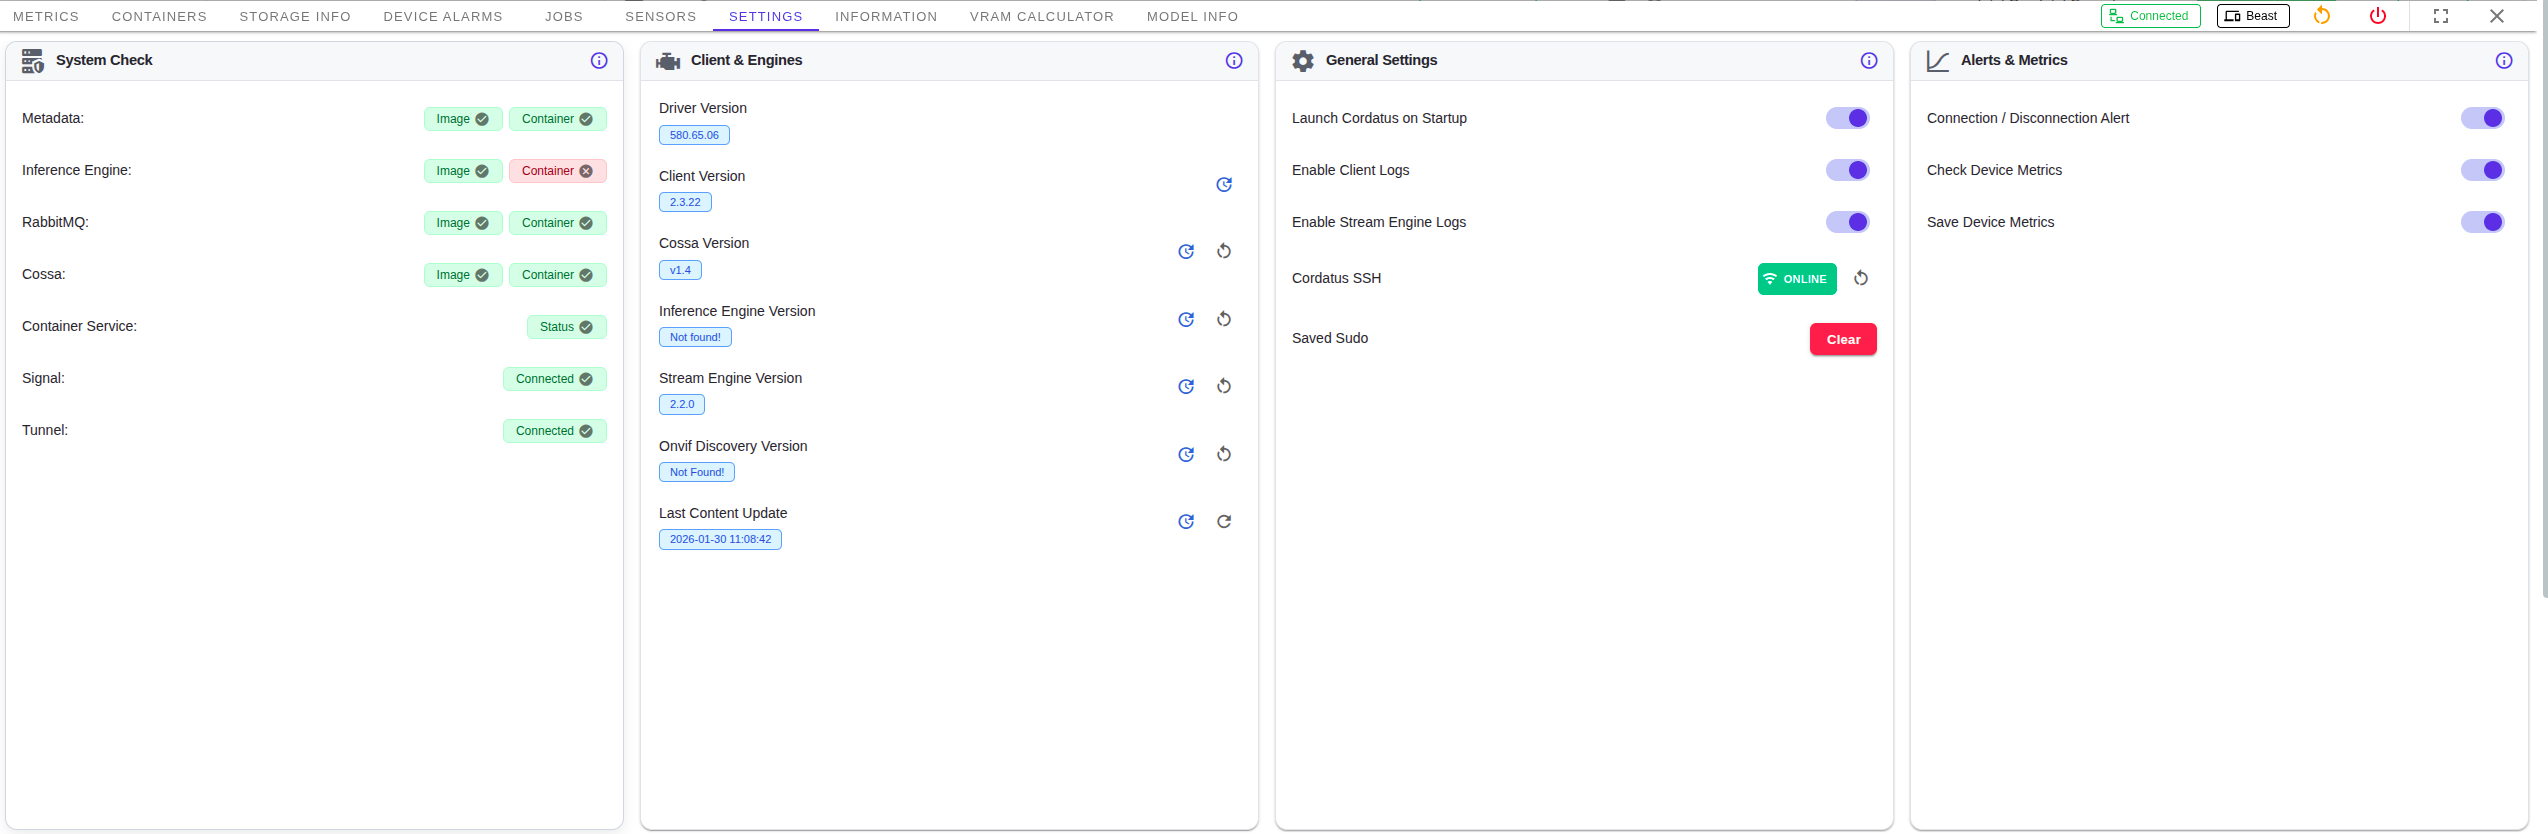
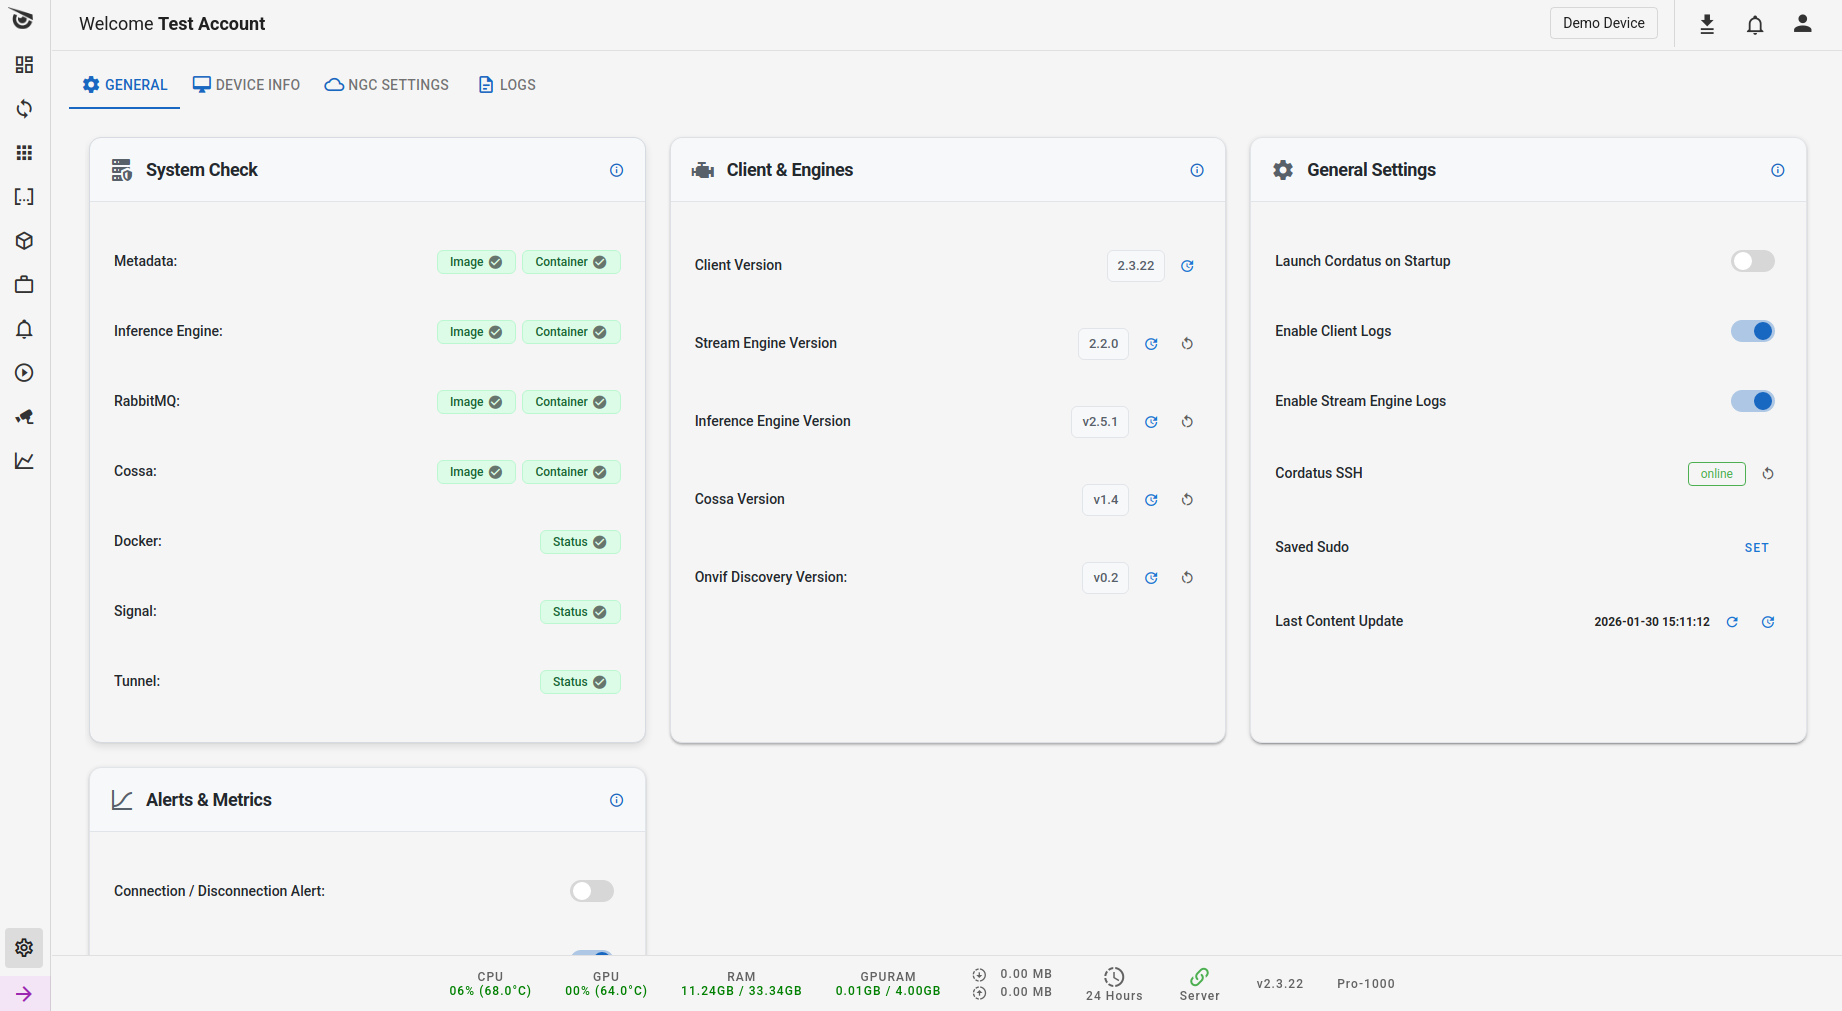
Settings
System Check
The System Check section under Settings verifies the health of key services and containers on the device. These services are Metadata, Inference Engine, RabbitMQ, Cossa, Docker, Signal, and Tunnel. Each component shows the status of its Image and Container.
| Component | Image | Container / Status |
|---|---|---|
| Metadata | ✅ | ✅ |
| Inference Engine | ✅ | ❌ |
| RabbitMQ | ✅ | ✅ |
| Cossa | ✅ | ✅ |
| Docker | — | ✅ |
| Signal | — | ✅ |
| Tunnel | — | ✅ |
If a red cross (❌) appears, that service or container is not running or failed to initialize.
Use Restart Client or check Logs to diagnose the issue.
Client & Engines
The Client & Engines section under Settings lists all clients and engines, showing:
- Whether they are installed
- Their versions
- A Check Update button
- A Restart Engines button
- An option to Run Stream Engine natively or in a container
General Settings
The General Settings section under Settings lists additional configuration options for the Cordatus Client and system behavior:
- Launch Cordatus on Startup — Automatically start the client when the system boots. (This option is also available on the Metrics tab.)
- Enable Client Logs — Toggle the collection of client logs for troubleshooting.
- Enable Stream Engine Logs — Toggle the collection of stream engine logs.
- Cordatus SSH — Displays SSH service status and provides a button to restart the SSH service if needed.
- Saved Sudo — Indicates whether a sudo password is stored and provides a button to clear it.
- Last Content Update — Shows the timestamp of the last update and includes a Check for Update button.
Alerts & Metrics
The Alerts & Metrics section under Settings lists configuration options for:
- Connection / Disconnection Alert — Enables or disables email or notification alerts when the device connects or disconnects from Cordatus.
- Check Device Metrics — Determines whether the Cordatus Client will actively collect realtime metrics from the device. This setting can also be changed on the Metrics tab using the Stop button in the top-right corner.
- Save Device Metrics — Determines whether collected metrics will be stored for historical analysis.
All of these settings can also be viewed and managed directly from the Cordatus Client → Settings → General tab on the device.
X86-Information
This tab provides detailed information about the x86 system hardware, software, and license features.
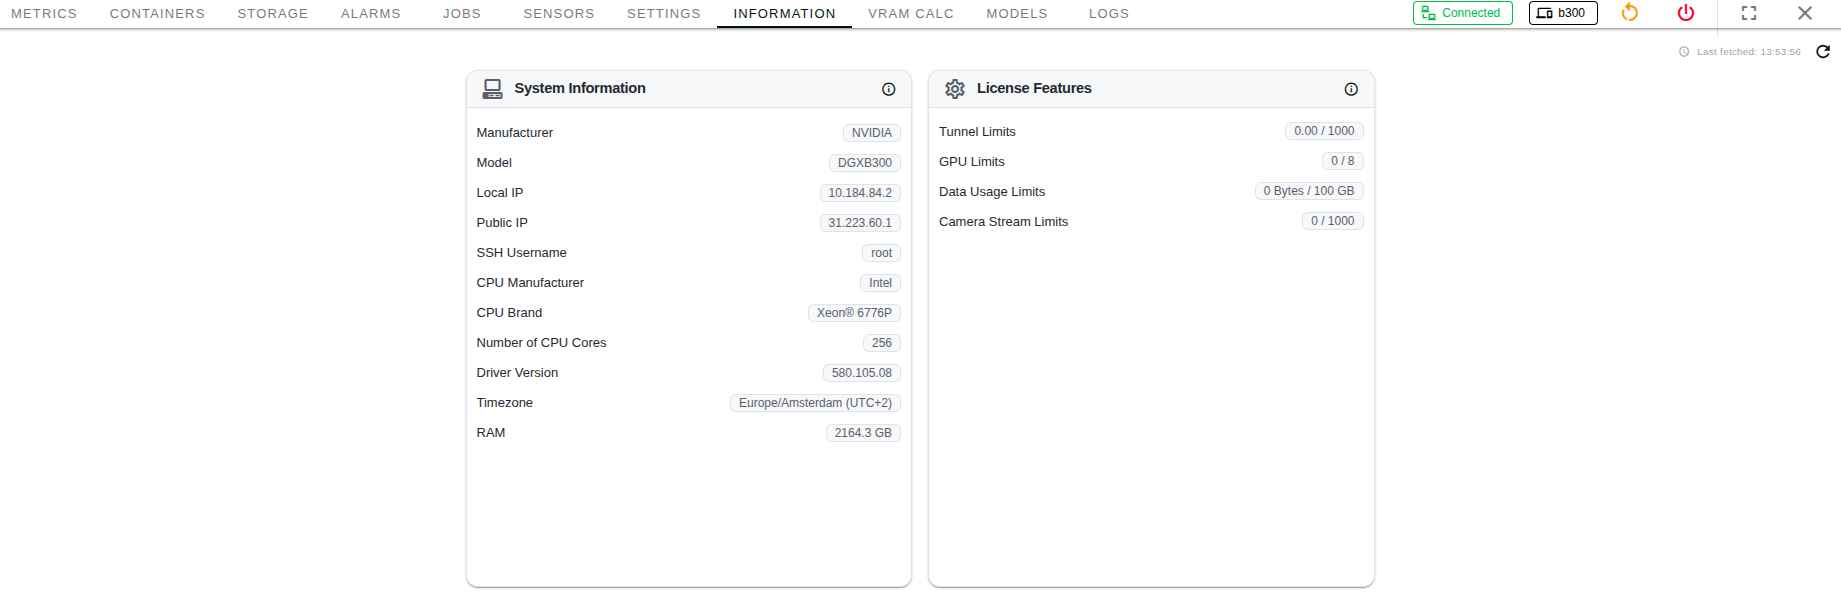
This information can also be viewed directly from the Cordatus Client → Settings → Device Info tab on the device.
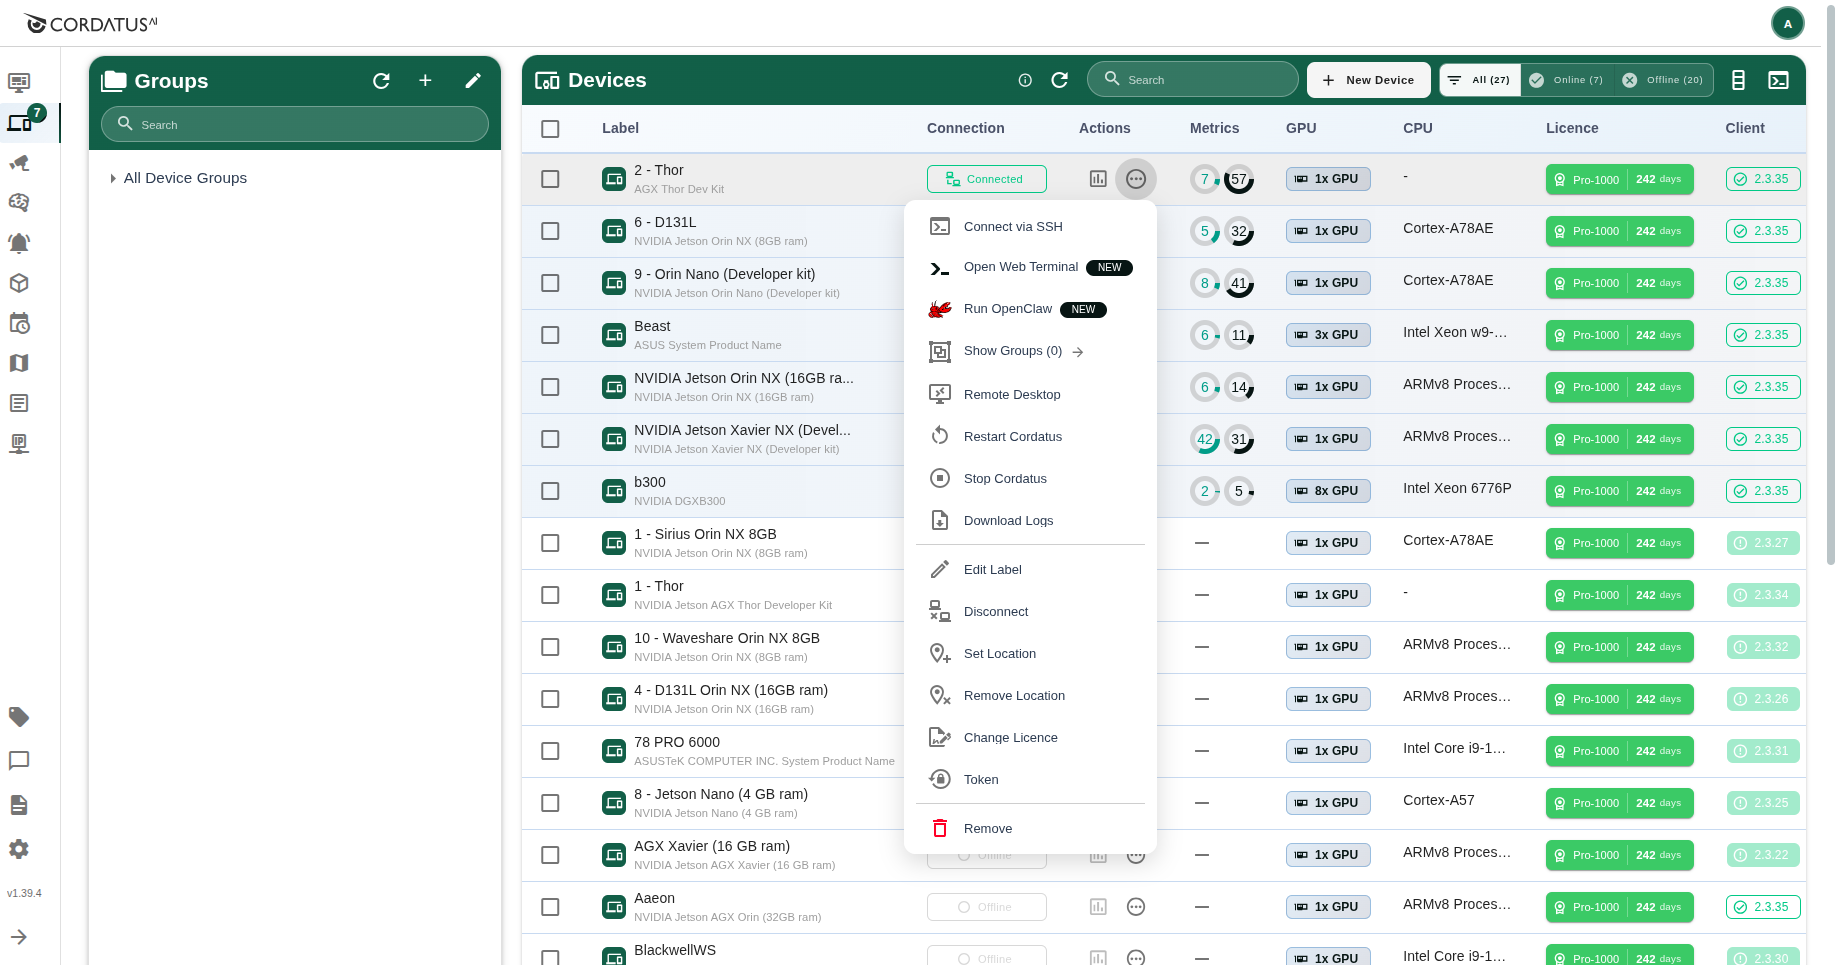
Ellipsis menu
Click the ellipsis icon under Actions to open the management menu. This menu provides access to features:
- Connect via SSH / Remote Desktop → Connectivity & Sessions
- Show Groups → Groups & Tags
- Restart Cordatus → Restart Client
- Download Logs → Download Logs
- Disconnect
- Set/Remove Location
- Change License → Change License
- Generate Token
- Remove → Remove Device
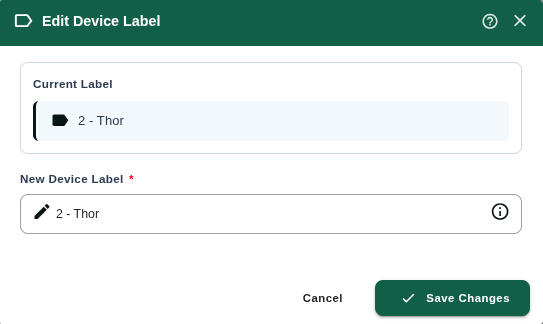
Rename a device
- Click the edit icon next to the device Name.
- Enter the new name.
- Click Save Changes.