Monitoring
The Monitoring page shows Realtime and Historical metrics for your devices.
For NVIDIA Jetson devices, it also includes the Jetson Control Center.
Realtime Metrics (Web)
- Go to the Devices page and find your device.
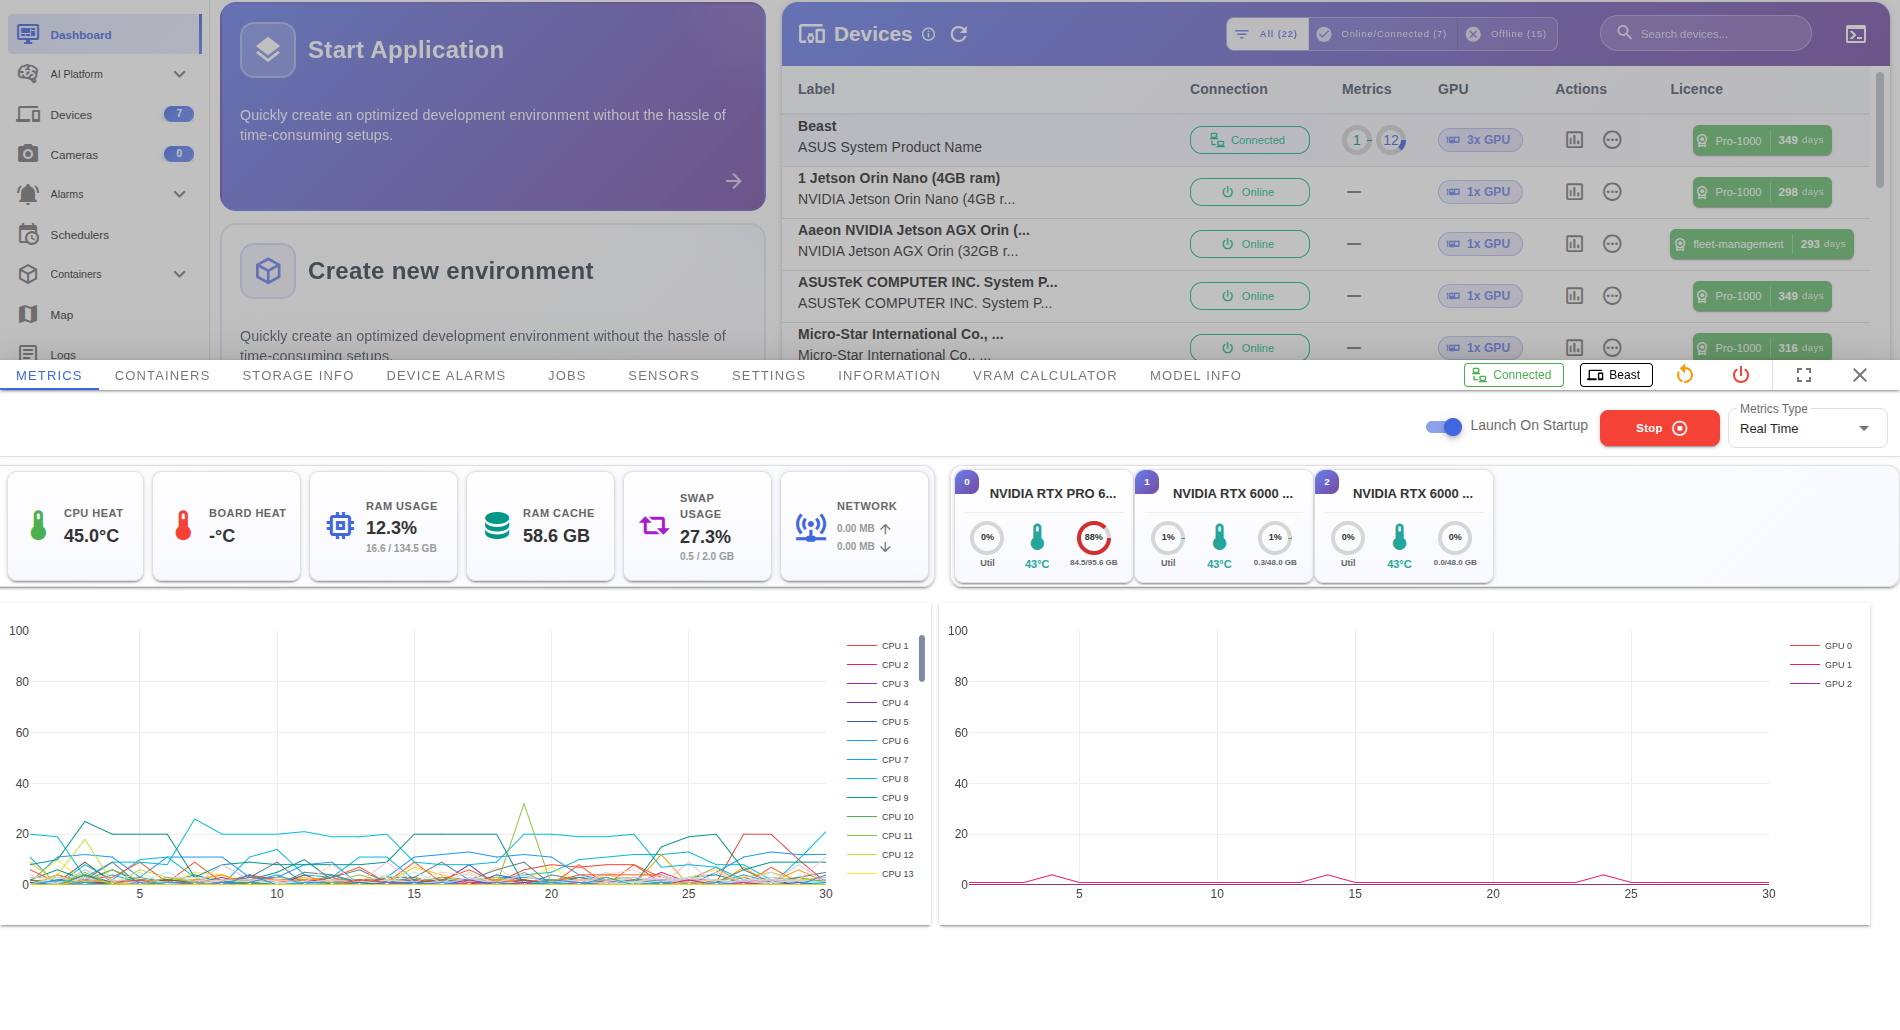
- In the device row, click the Metrics icon. The metrics panel opens at the bottom and shows realtime charts.
You will see:
- CPU — usage (%) and temperature (°C)
- GPU — usage (%) and temperature (°C)
- RAM / SWAP — usage and total
- GPU Memory — usage (MB / %)
- Board Heat (Jetson) — SoC / board temperature
- RAM Cache — OS filesystem cache
- Network — upload / download throughput
Realtime Metrics (Client)
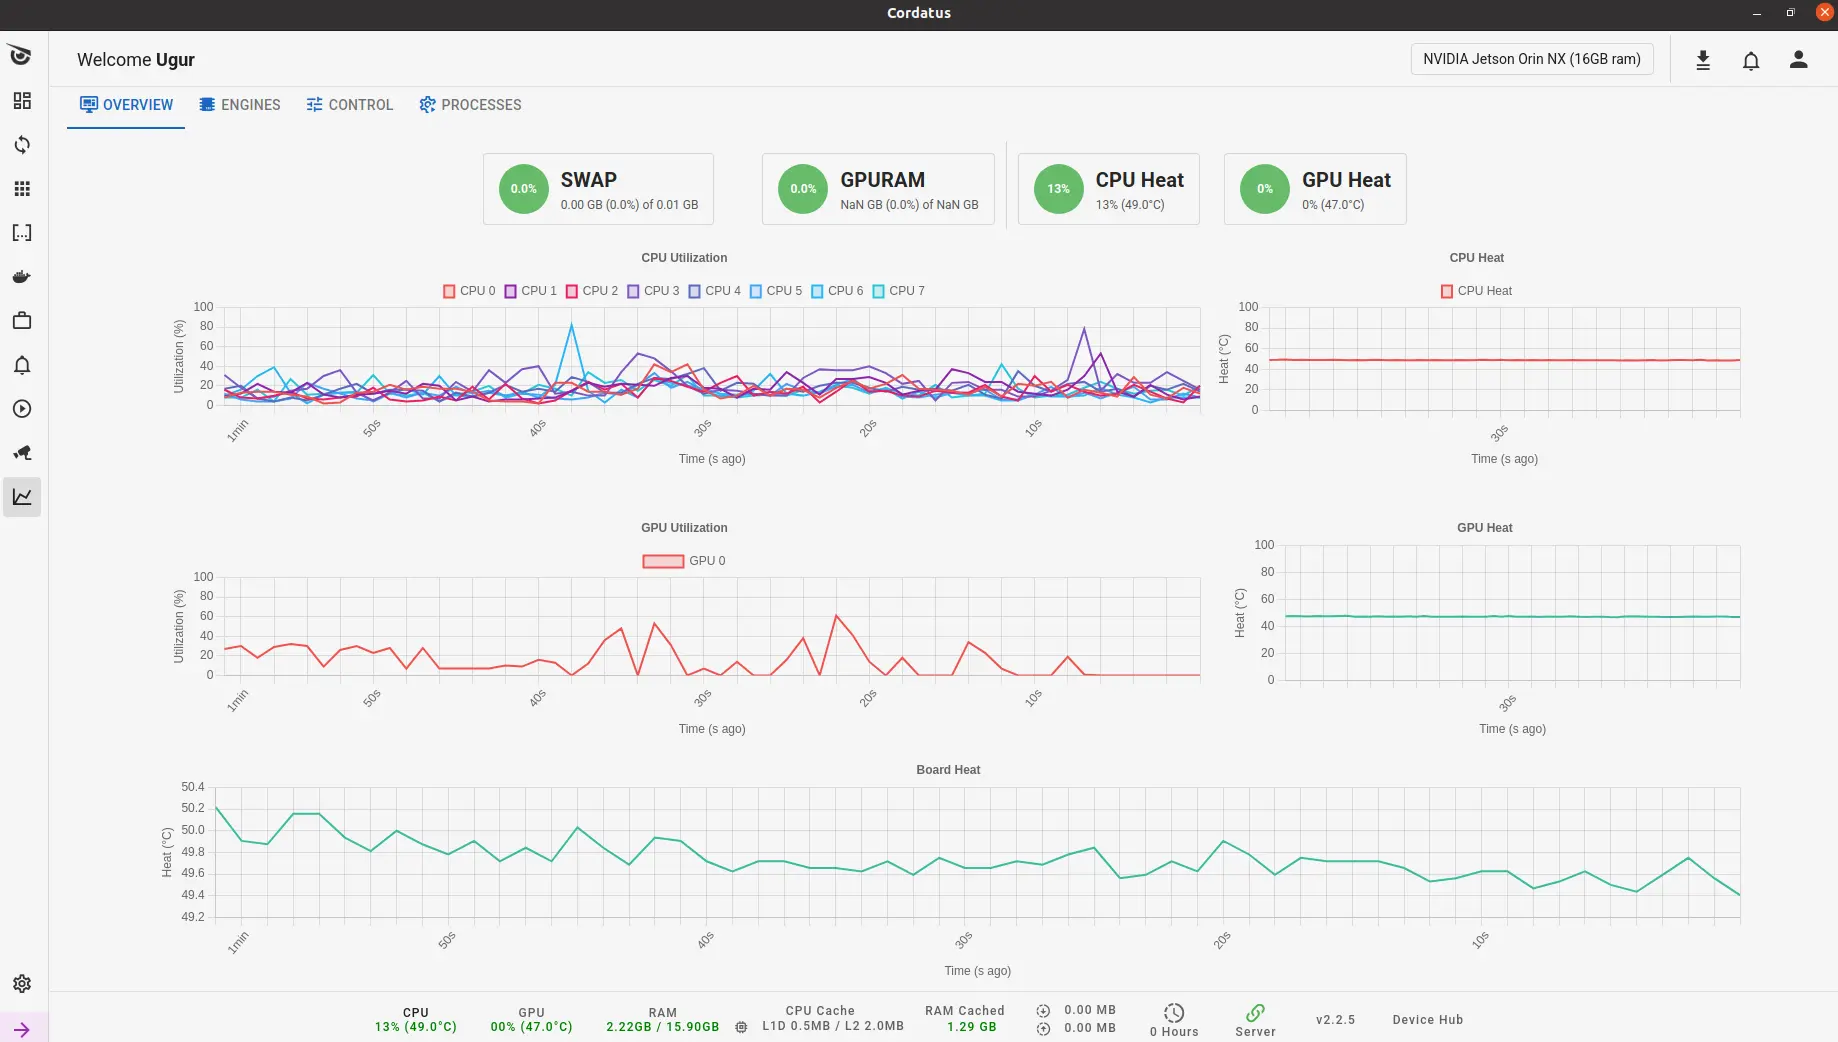
The same realtime metrics are also visible directly in the Cordatus Client application on the device.
Open the Overview tab in the Client to see:
- CPU/GPU usage and temperature
- RAM and GPU RAM usage
- SWAP usage
- Network activity (upload/download)
- Uptime, client version, server connection status
- Board Heat (Jetson only)
The Client view is local and quick for a single device.
The Web Monitoring view is centralized, giving you fleet-wide visibility and history.
Historical Metrics
Steps:
- Open Metrics
- In the top-right of the panel, set Metrics Type to Historical.
- In the dialog, make your selections:
- Select Interval — choose the time interval (e.g., 1h, 24h, 7d).
- Select Time — pick a specific custom range or use a preset.
- If you have chosen a custom time range, select the start and end times for the data.
- Click Get Metrics
Monitoring Controls
These settings change how metrics are collected and shown:
-
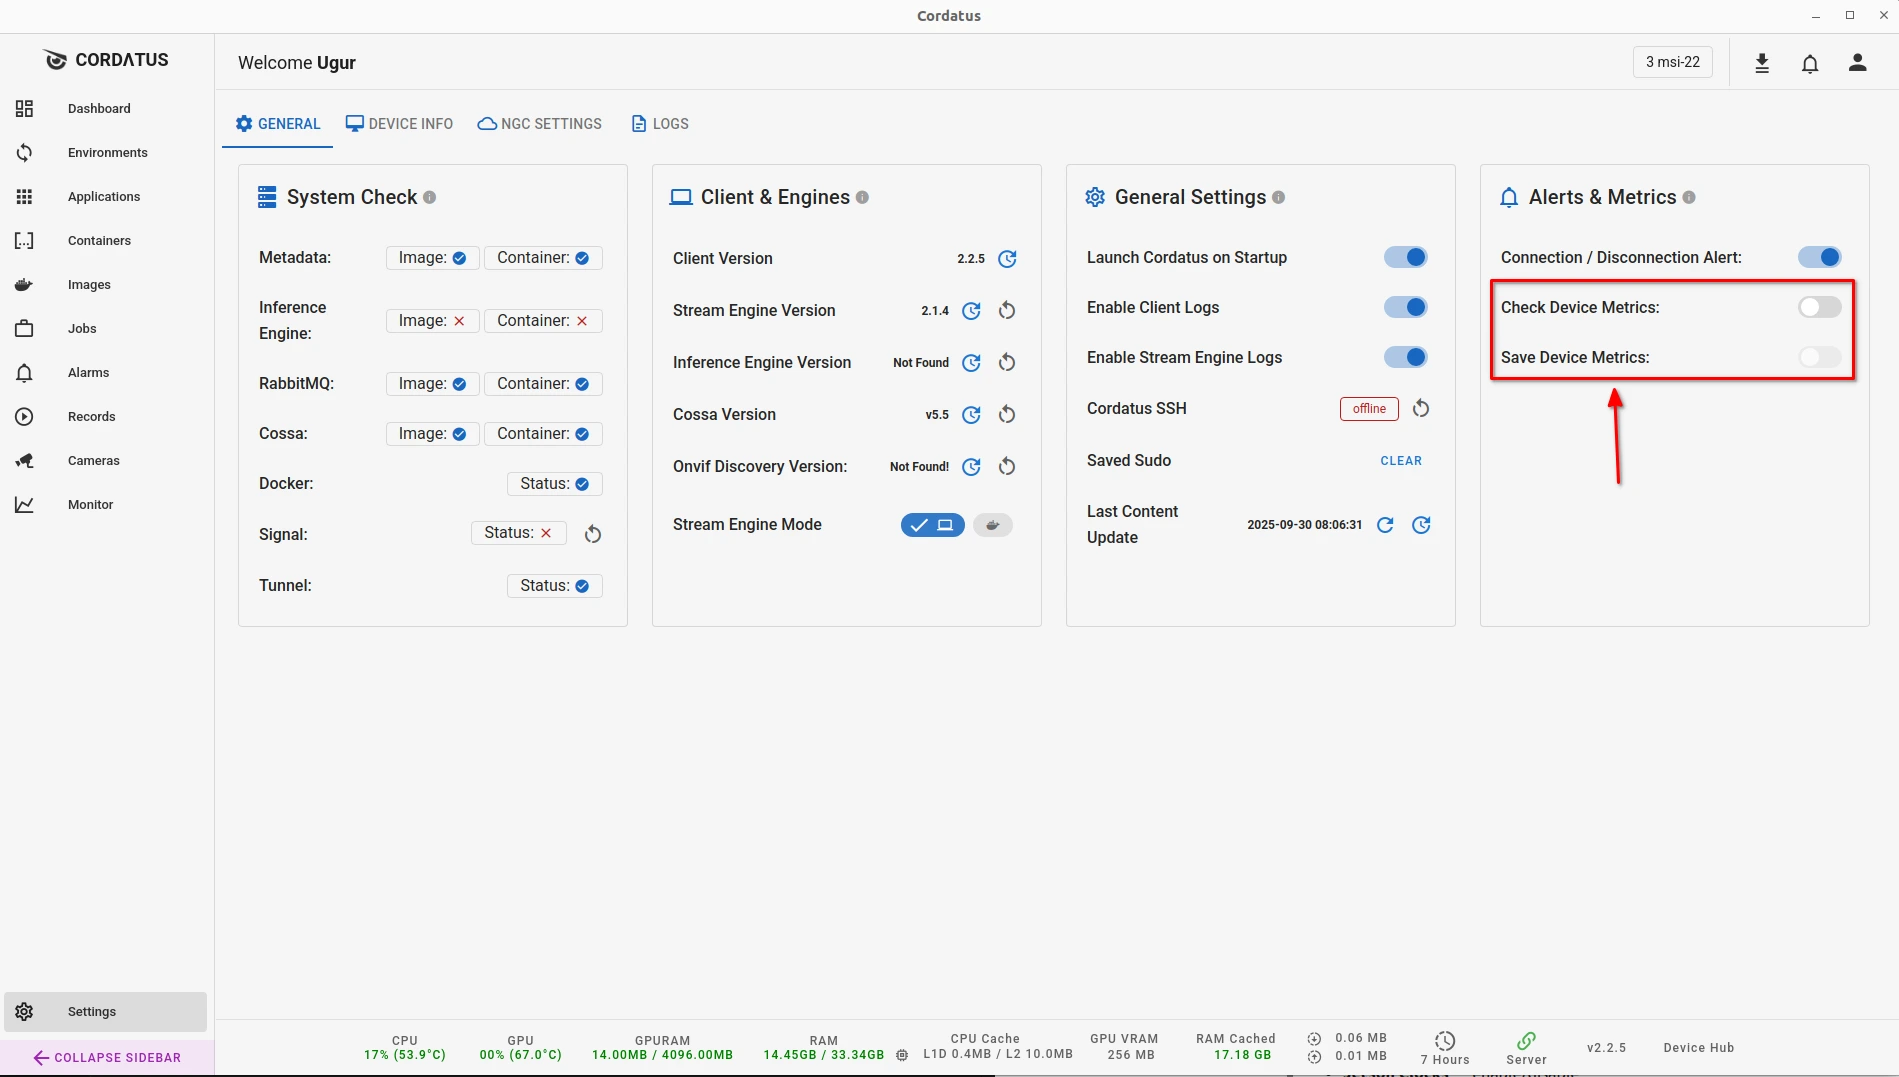
Check Device Metrics — Turn the metrics collector on/off.
- Quick way: click Stop in the top-right of the Metrics panel.
- From settings: Settings → Alerts & Metrics → Check Device Metrics.
- If OFF, realtime charts pause and historical data will not be recorded.
-
Save Device Metrics — Choose whether to store metrics history on the device.
- From settings: Settings → Alerts & Metrics → Save Device Metrics.
- If OFF, historical charts may be empty (new data won’t be saved).
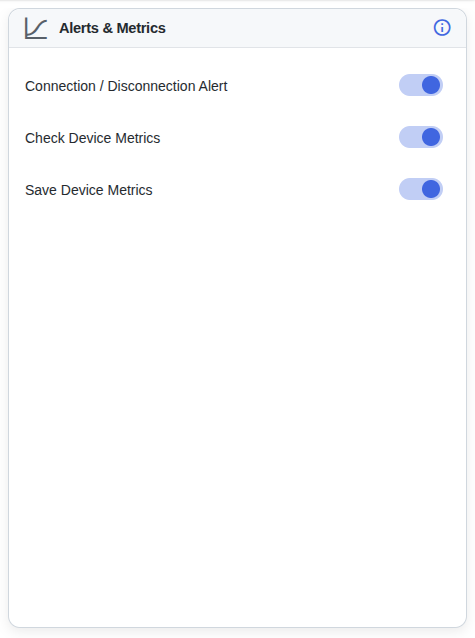
You can adjust the same toggles in the Client app:
Client → Settings → General → Alerts & Metrics.
Jetson Control Center
For NVIDIA Jetson devices, there is an extra tab: Jetson Control Center.
It has three sections: Control, Engines, and Information.
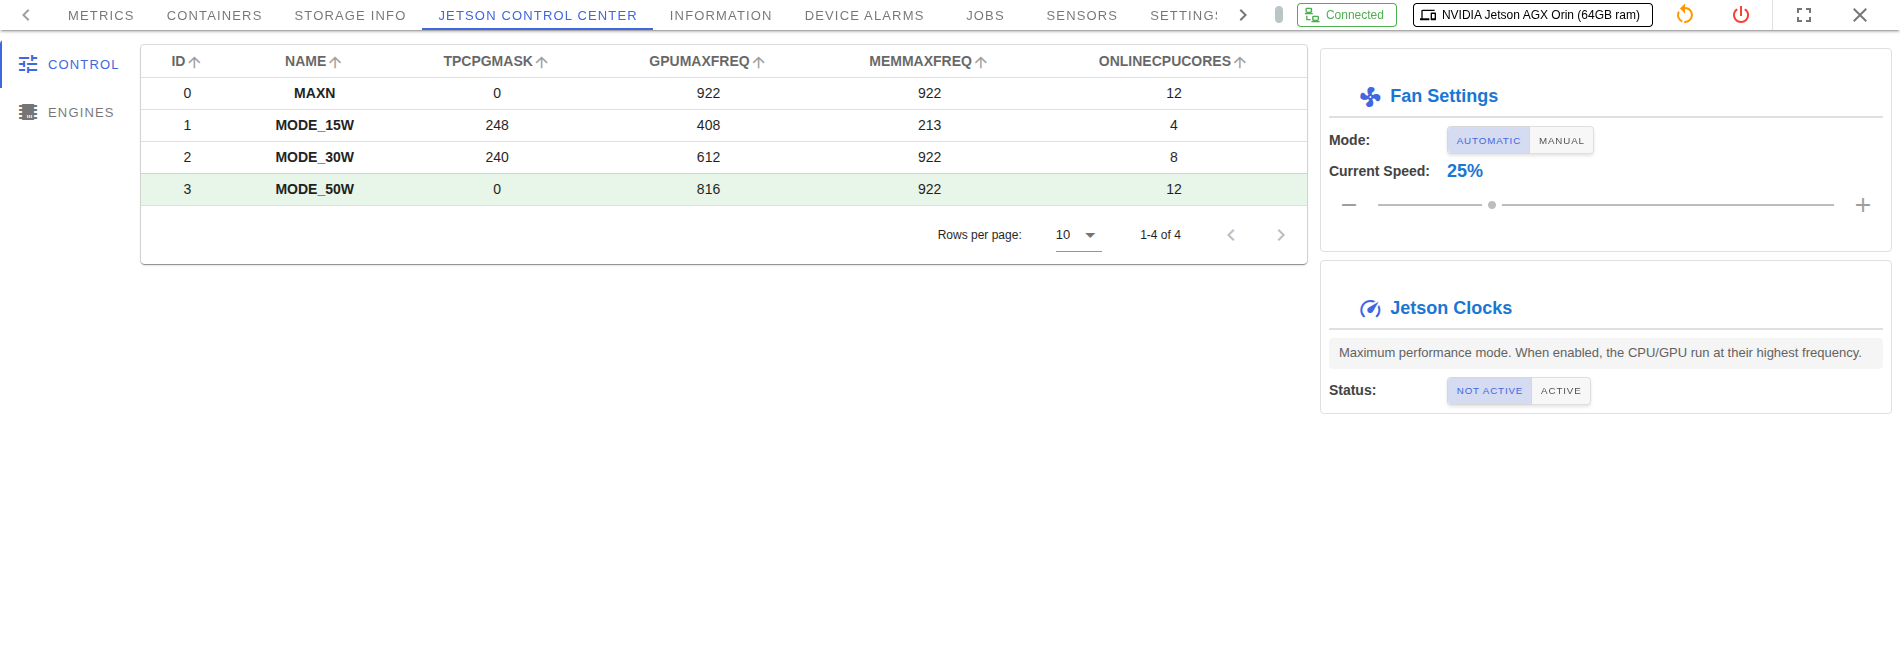
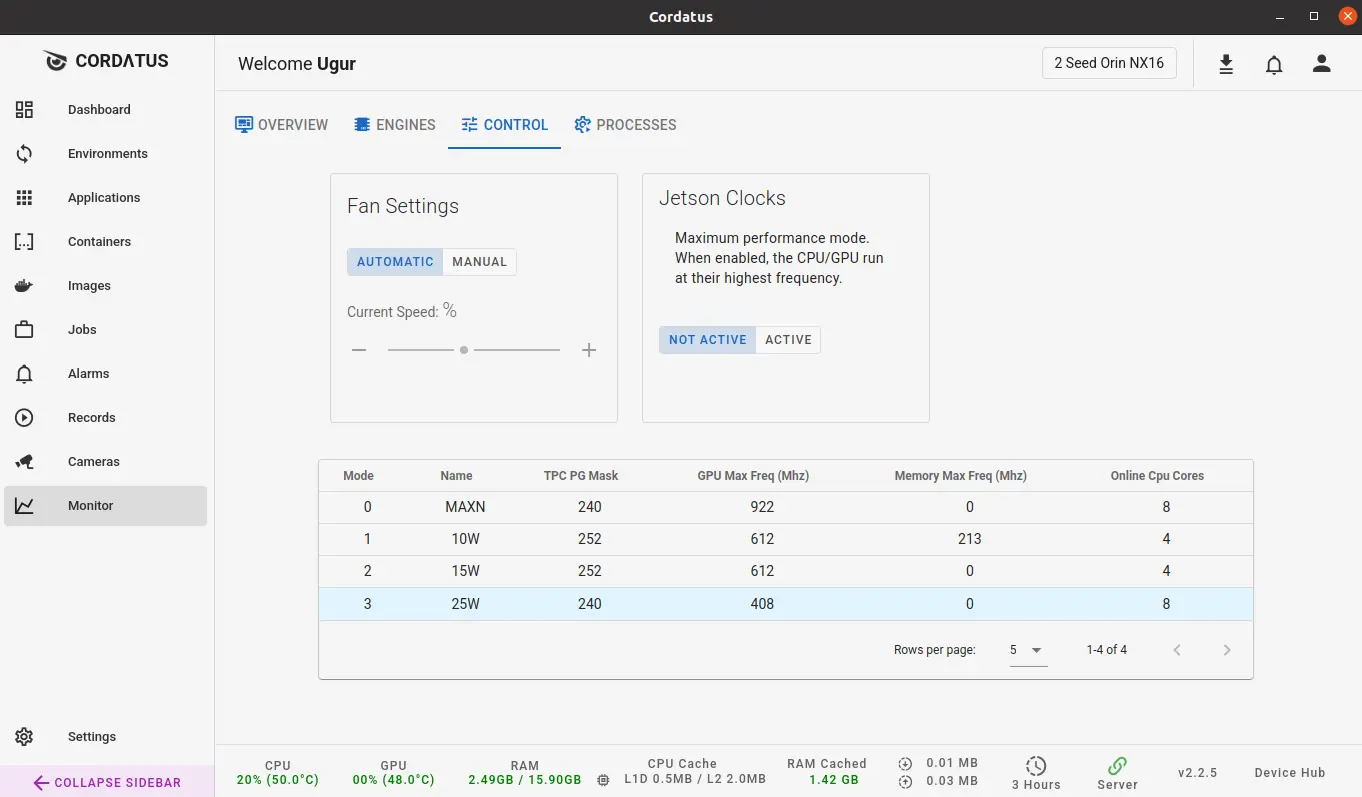
Control��
- Power Mode — choose performance or power-saving based on your workload.
- Fan Control — Automatic (system managed) or Manual (set fan speed yourself).
- Jetson Clocks — enable/disable Jetson Clocks for consistent high performance.
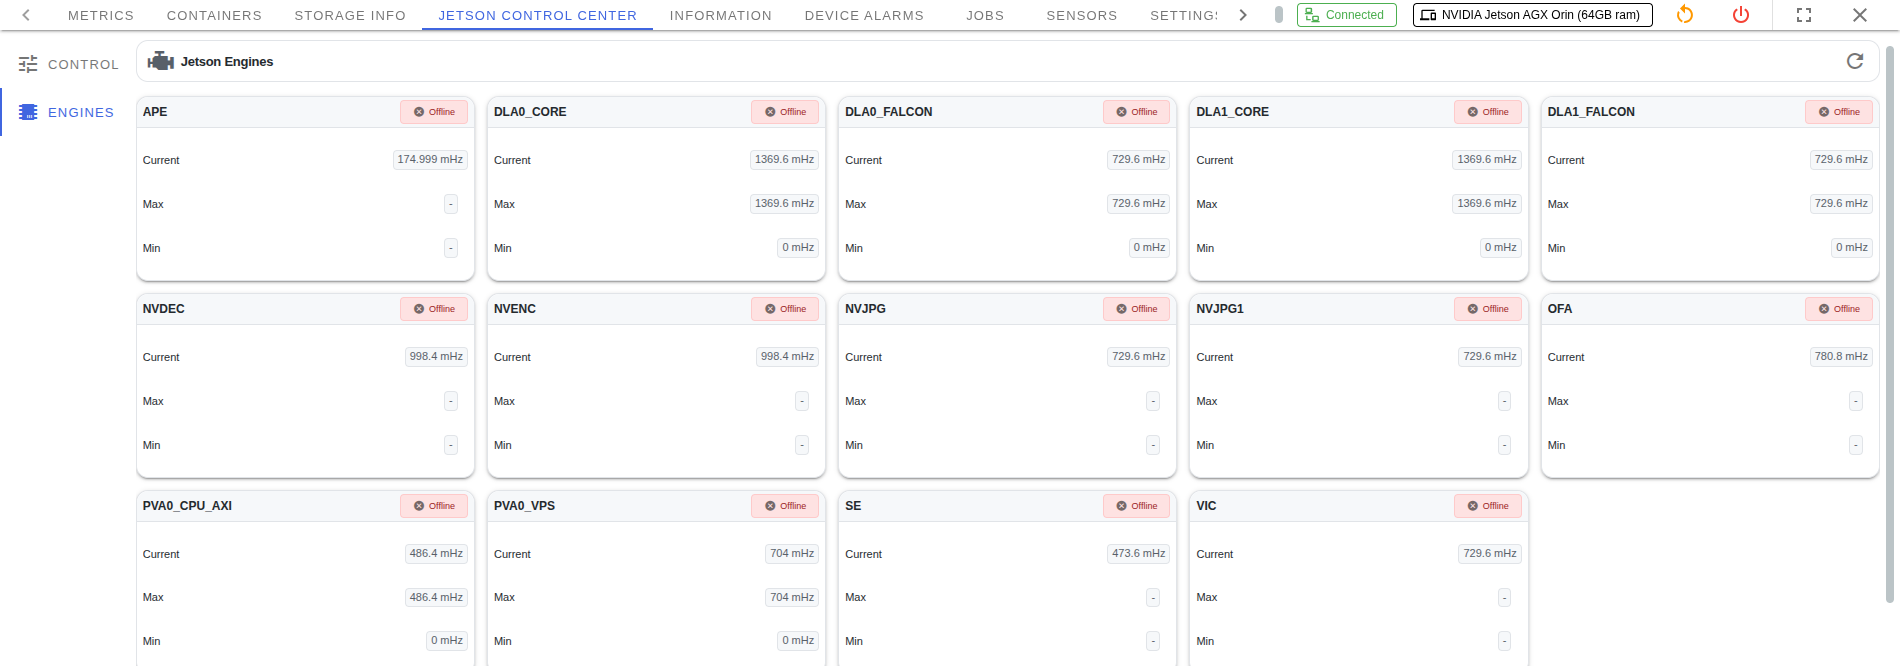
Engines
View Jetson engine tiles and their status (e.g., Online/Offline) with current / max / min frequency readouts.
Use the refresh button to update the values.
Common engines include (names may vary by model): DLA cores, NVENC, NVDEC, NVJPG, APE.
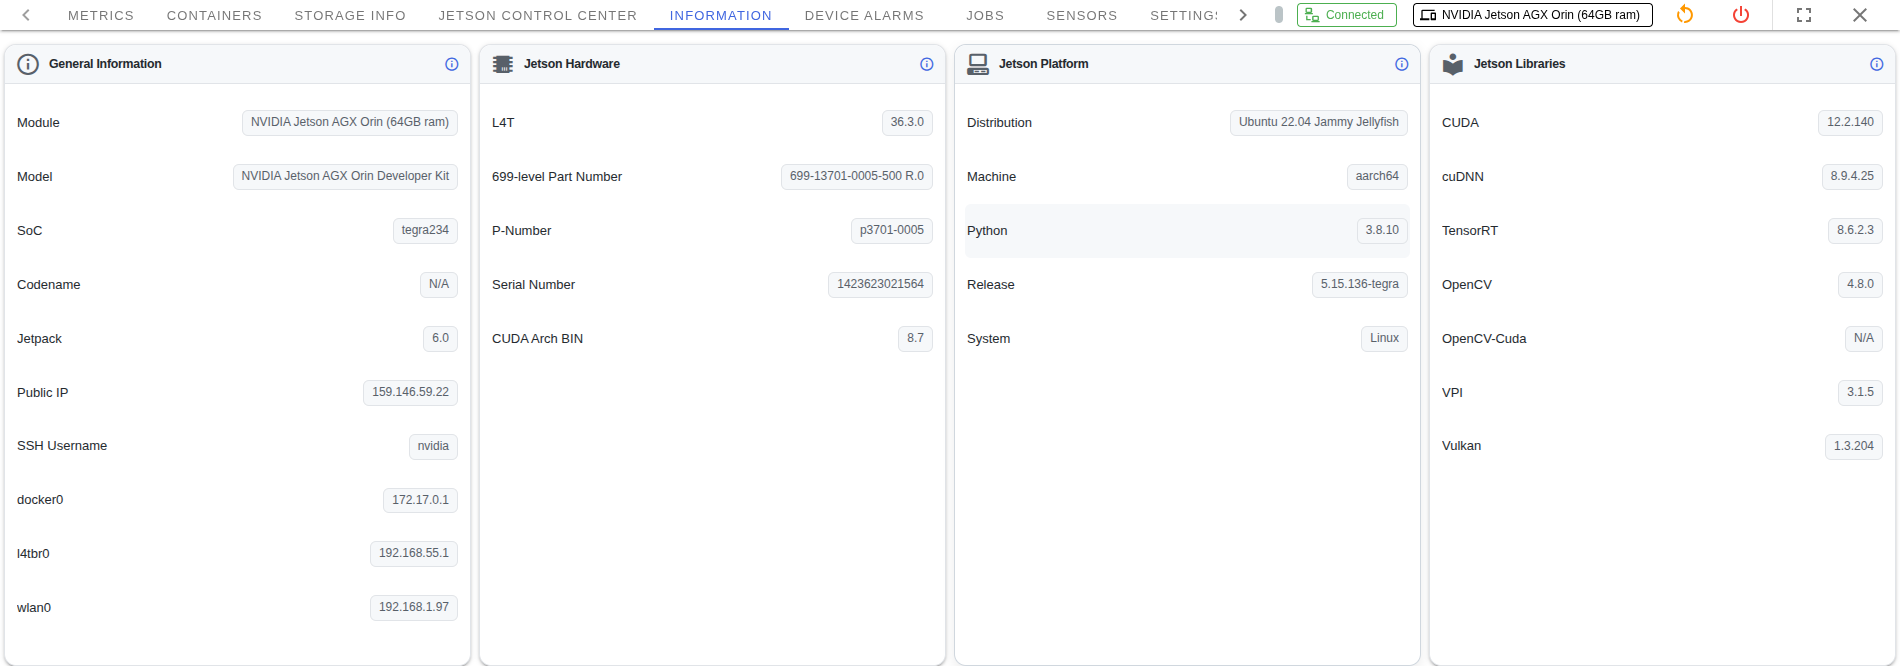
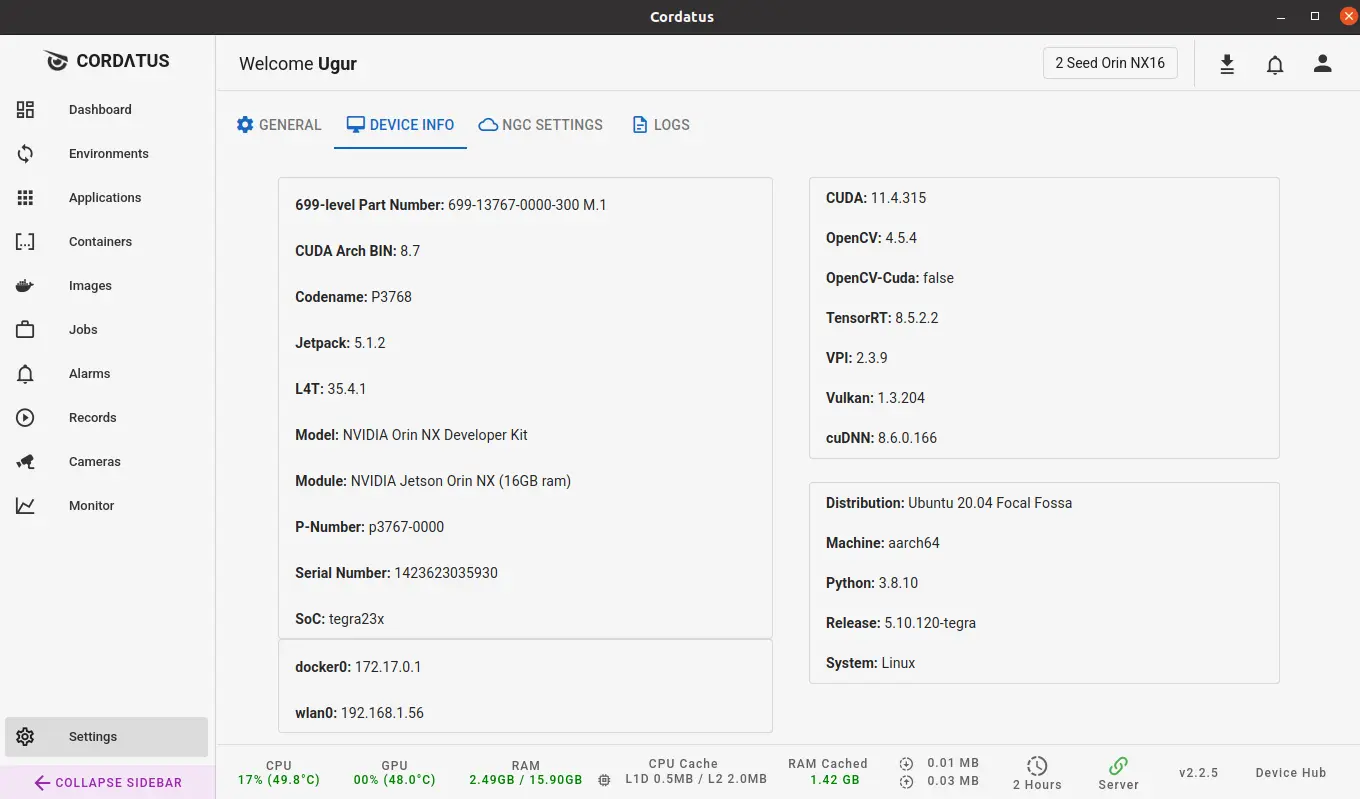
Information
Read-only hardware and software details of the device, grouped as:
- General Information — Module, Model, SoC, Jetpack, network interfaces
- Jetson Hardware — L4T, part numbers, serial, CUDA arch
- Jetson Platform — OS distribution, kernel release, Python, system
- Jetson Libraries — CUDA, cuDNN, TensorRT, OpenCV, VPI, Vulkan
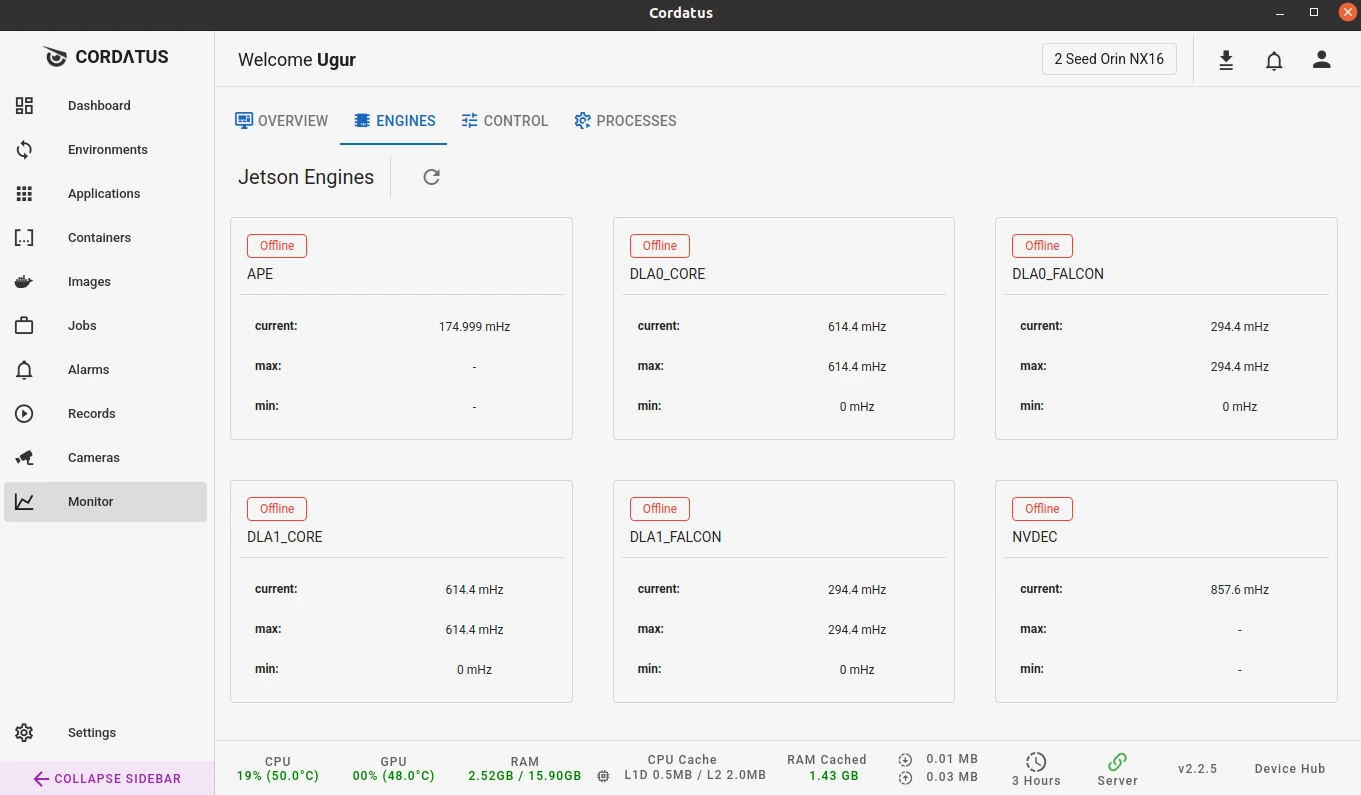
Also available in the Client (on-device)
The same data is visible inside the Cordatus Client app:
- Engines data → Client → Monitoring → Engines
- Control settings → Client → Monitoring → Control
- Information details → Client → Settings → Device Info
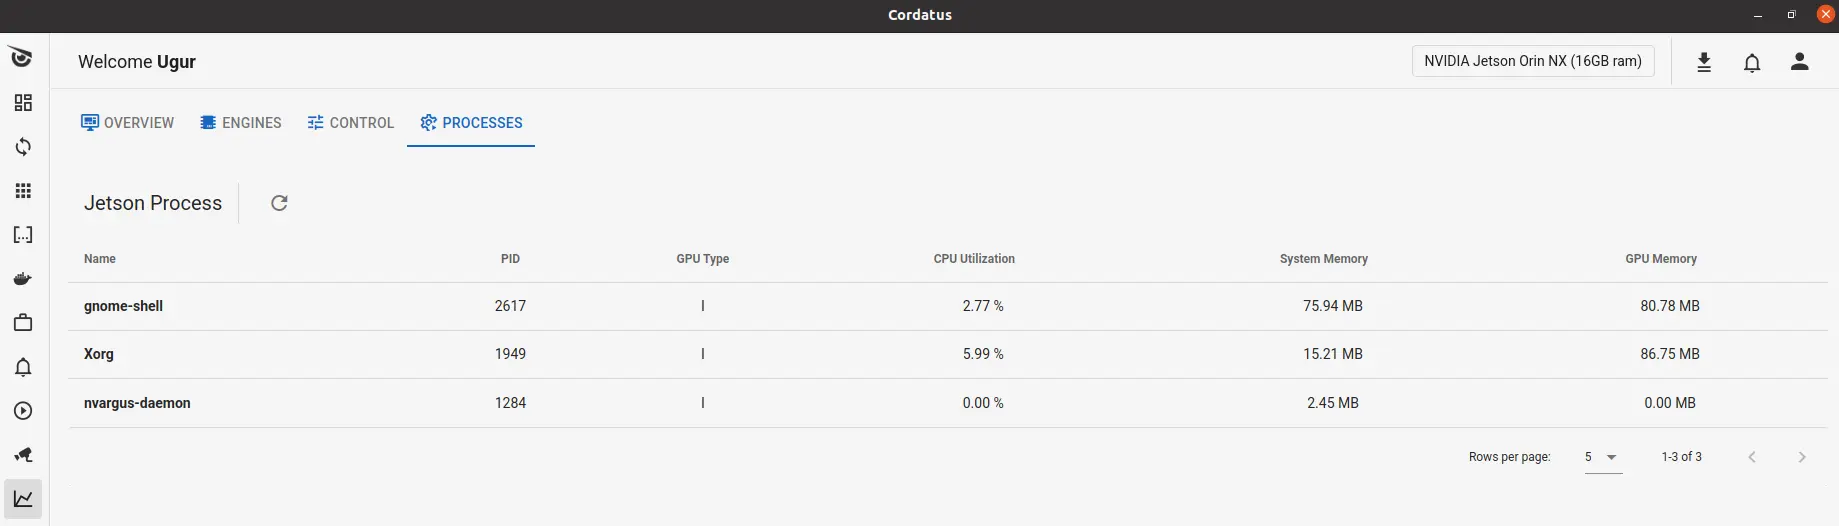
- Processes → Client → Monitoring → Processes
See active tasks and applications currently running on the Jetson device.
This helps monitor resource usage and troubleshoot running workloads.
Client view is local and quick; the web Monitoring view is centralized and better for fleet-wide checks and history.
Tips
- No metrics? → Device must be Connected and Check Device Metrics enabled.
- Empty history? → Enable Save Device Metrics and wait for data.
- Remote desktop slow? → On Jetson, try higher Power Mode or Jetson Clocks.